Goal
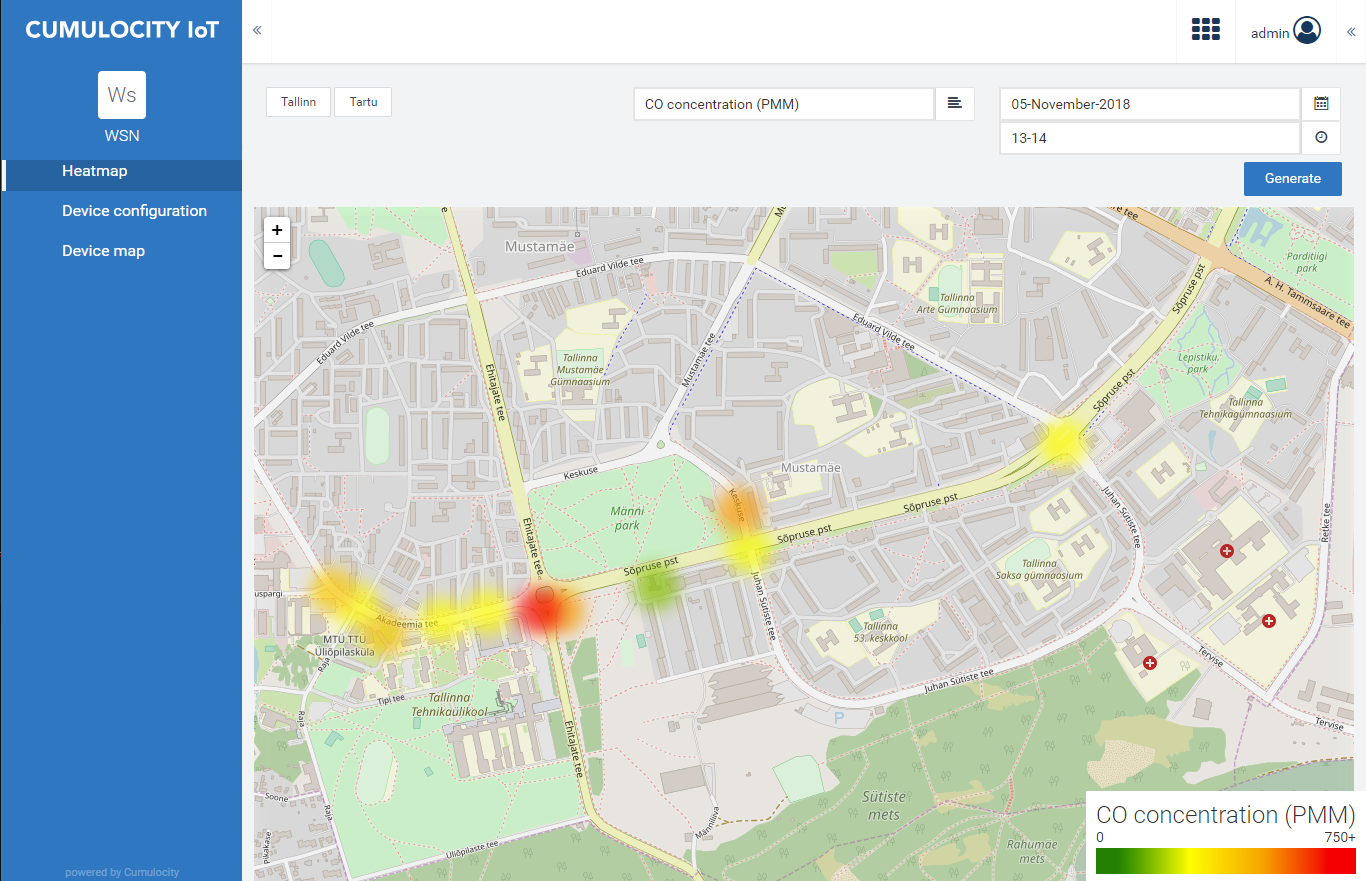
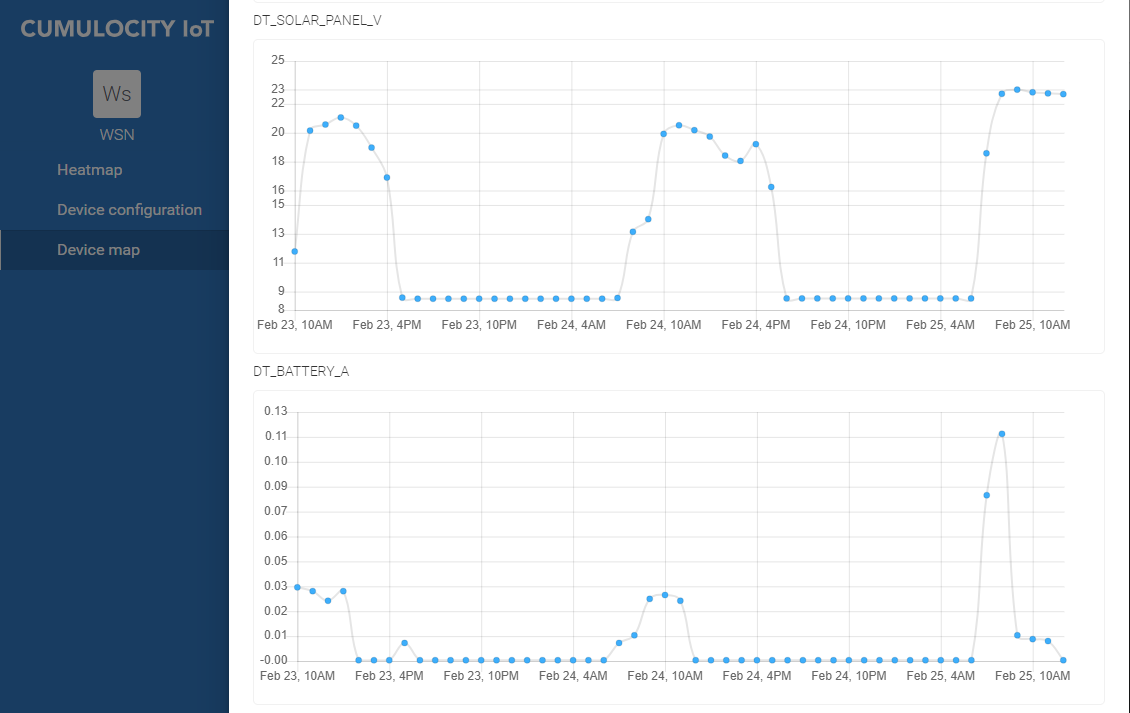
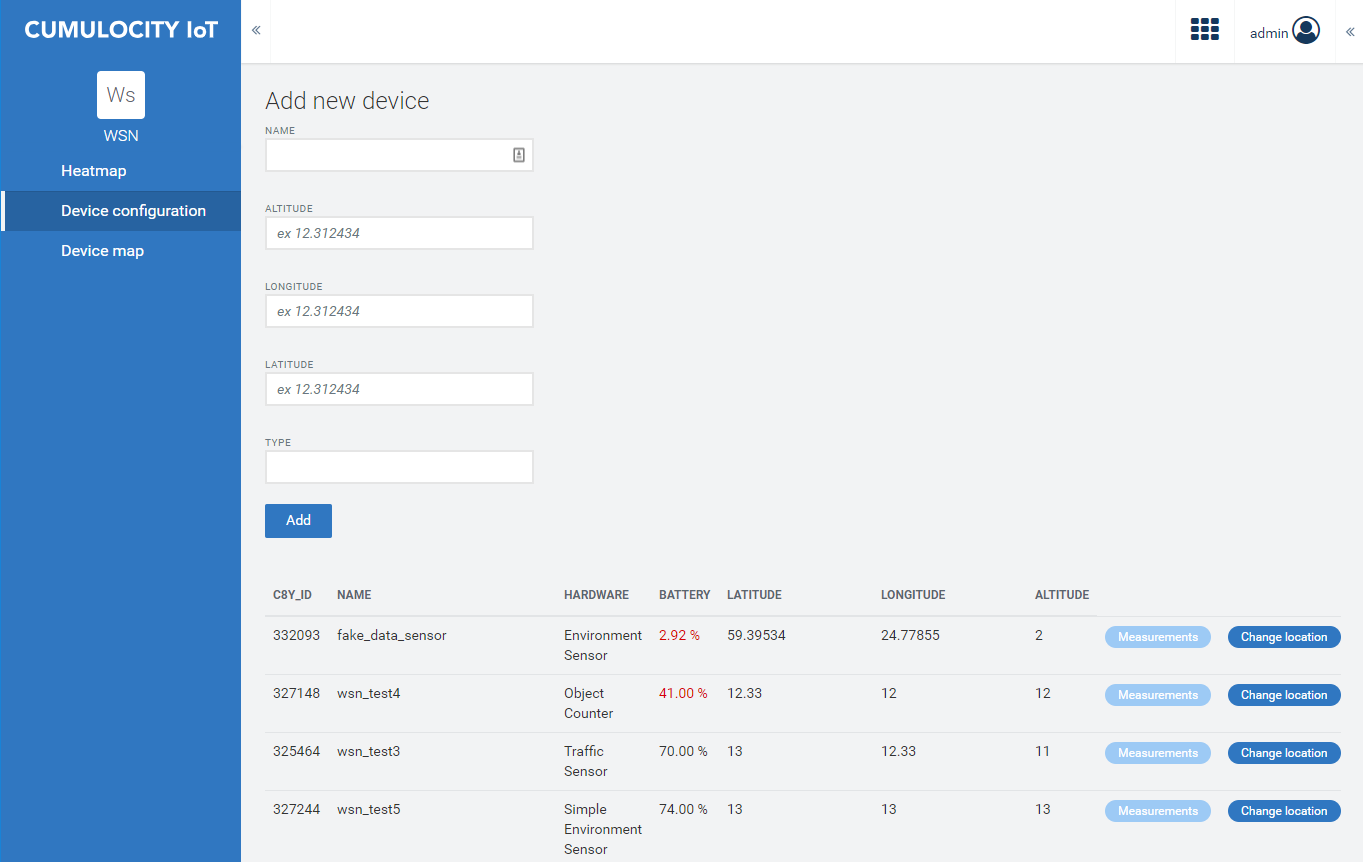
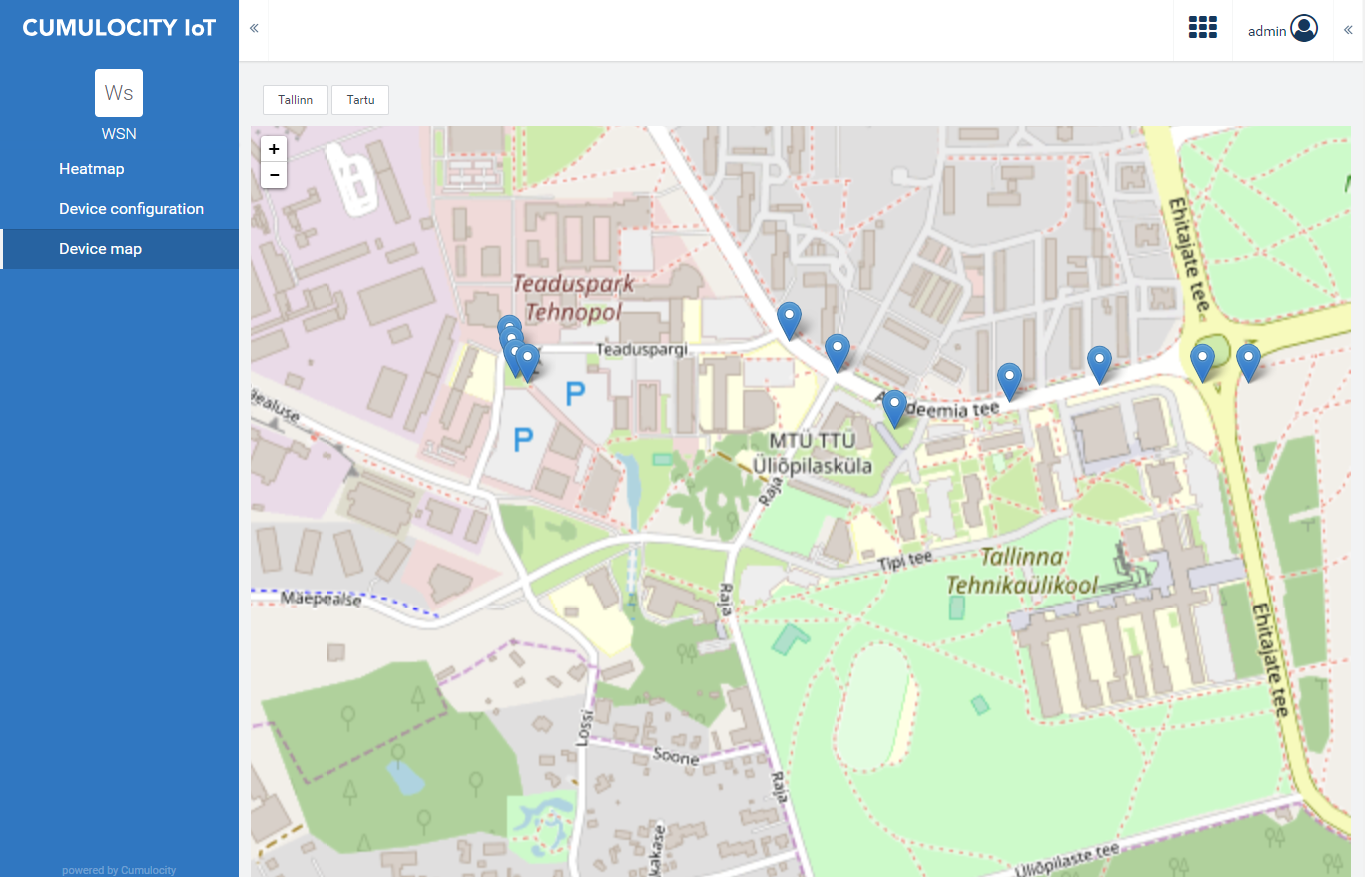
Project goal was to visualize data sent by smart city sensors that include air quality and traffic monitoring data. Visualization was planned to implement on Cumulocity platform. Cumulocity is on of the leading independent Device and Application Management Internet of Things (IoT) Platform since 2010 that connects and manages all devices effortlessly. Developed application enables to manage devices and configure their parameters. It is possible to see on the map a location of each device and heat map of each individual sensor.
- Funding source(s): ETAG
- Start and end dates: 09.2018 – 12.2019
- Project manager: Jaanus Kaugerand
Implementation of research outcomes
During the project following sensor readings were implemented:
- CO, CO2, NH3 concentration
- PM 1.0 and 2.5
- Vibration of sensor on 3-axes
- Athmospheric pressure
- Temperature
- Relative humidity
- Light intensity
- Noise level
- Vehicles per minute
- Movement events per minute